An Introduction to Accounting Dashboards
Posted 5 years ago by Tracy
When running a business and managing accounts, it’s crucial to have a clear insight into the state of your finances. From cashflow and outstanding invoices to bank account overviews and profit and loss, being able to see at a glance how the numbers are looking can help you make business decisions, plan for the future and ensure payments aren’t overlooked.
Keeping all of this information in silos, however, can make monitoring the finances a time-consuming task, while manually inputting numbers will increase the opportunity for errors to creep in. Dashboards, therefore, are a powerful tool when it comes to avoiding these issues.
Real-time accounting dashboards, such as those in AccountsPortal, make it easy to focus on KPIs with simple, intelligible graphics making it instantly clear what state a company’s finances are in. The ability to compare year-on-year and month-on-month figures means decisions can be made based on current situations as well as long-term trends. So if profit has been growing consistently now could be the time to invest in new people or machinery. If October is always a quiet month, maybe additional promotion in the run-up would level that dip. And having a clear understanding of your financial situation will help if you’re looking to source additional funding. Being able to explain your situation to a potential lender not only boosts your professionalism but also makes it much more likely that you’ll get the finance you require.
Instead of simply reporting on what has already happened, dashboards also make it easier to identify and address any potential issues quickly, or project the figures forward to highlight the direction in which the business is heading. This insight can also take off some of the pressure associated with month-end financial reporting. Rather than coming across any nasty surprises when collating your figures, you’ll already be monitoring any potential problems and be primed to respond proactively rather than reactively.
For example, clear graphs will highlight if invoices are overdue. Over time it will soon become clear if certain clients are regularly not paying their invoices on time. Having this knowledge means you can factor this into your financial planning and also creates the opportunity to reach out to the client in advance to attempt to reduce the delay.
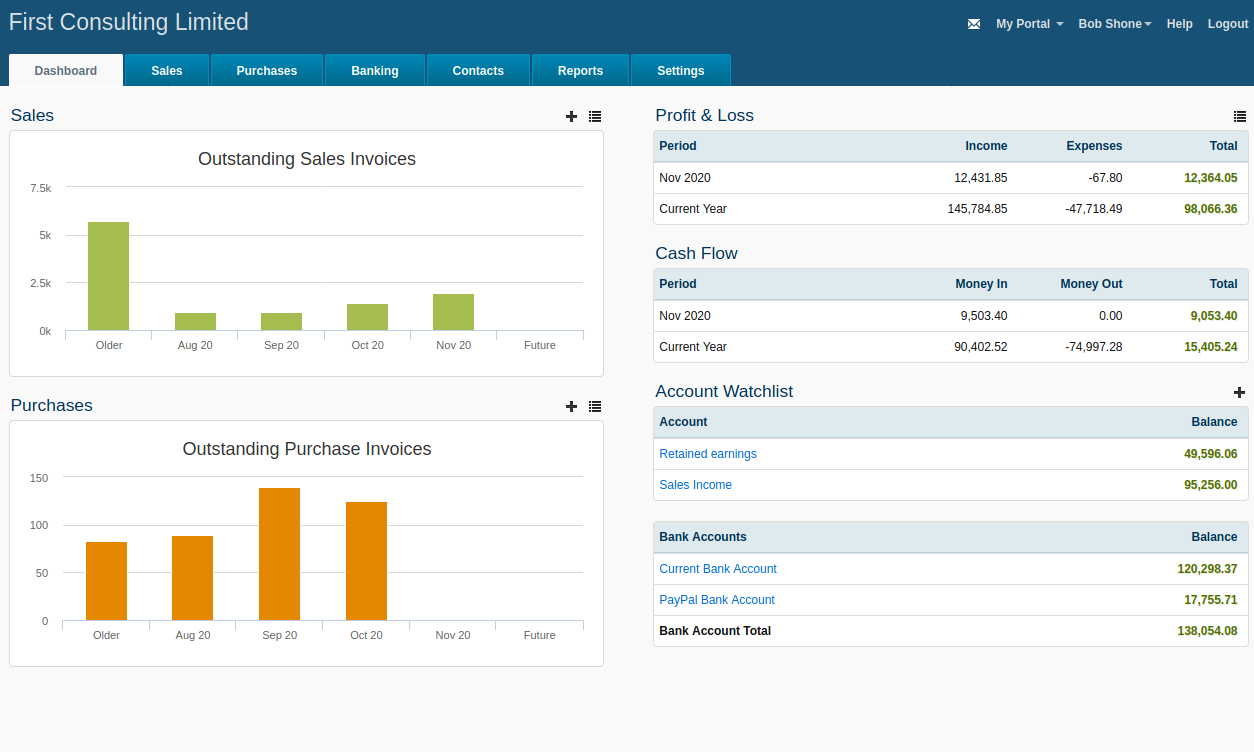
Dashboards that record data in real time are designed to offer clarity and convenience, providing at a glance information on how a company is performing.
Dashboards in AccountsPortal cover four key elements:
-
Outstanding sales invoices: This provides a snapshot of your invoices, highlighting sales by month, past, present and future, in a clear graphical form. New sales can be added in a single click from the dashboard, and you can navigate directly from here to a more detailed overview of your business’ sales performance. Once an invoice has been issued, it will appear in the dashboard with an assigned due date. As soon as this is passed, it will be clearly labelled as overdue. How is this useful to business owners and accountants? Consider, for example, a company that has only been operating for six months. This dashboard will show what has been invoiced and what has been paid and by which company, making it easy to prioritise who to chase and when.
-
Outstanding purchase invoices: Following the same layout as outstanding sales invoices, this section highlights purchase invoices that are yet to be paid, organised by month. Again, it is possible to add new purchases and view purchases with a single click away from this page. Having this information available at a glance makes it easy to see when money is due to leave the business and therefore manage payments across the business. So, for a business with purchase invoices of £80,000 and outstanding invoices of £100,000 due in the next 30 days, it becomes clear that managing invoices will be key to maintaining cash flow.
-
Cash flow: Moving down the page and the cash flow section provides a more detailed up-to-date summary of inflows and outflows, viewable as a cumulative total (i.e. running balance for the year to date), or on a per-month basis. Having clear, concise data here makes spotting potential issues much easier, enabling changes to be made quickly and forecasting future cash flow to be more accurate. This is of huge benefit to businesses of all sizes, helping to inform decisions across the organisation. Take a business that is considering expanding, whether to a new location or in terms of headcount. Cash flow can be an important metric here, providing insight into whether a company is in a strong enough financial position to support any investment.
-
Profit and loss: This section of the dashboards page shows income, expenses and total profit or loss by month and year in a clear table format, allowing you to quickly achieve a company-wide financial overview for the month and year-to-date. To delve into more detail, simply click the icon above the table for a full breakdown of your P&L statement. This information is vital to pretty much every aspect of your business, particularly when it comes to managing risk. If your forecast is positive, it could be the right time to invest in R&D, staff or products. But if the outlook is less optimistic, caution could be advised alongside a concerted effort to increase productivity. Back to that company that is battling its way through its first year of operation. Outgoings have been high as the firm establishes itself, but as these are essential costs they haven't been closely tracked. Looking in more detail at the P&L statement shows that outgoings have been £80,000 and income £100,000, so while the business is making profit, it's perhaps a sign that costs need to be monitored more closely going forward.
-
Account Watchlist: Here, you can view the current balance on any of your accounts, including credit cards, current and savings accounts, and petty cash. Simple navigation makes it quick and easy to add or remove items from the watchlist at any time, while a Bank Account Total provides insight into the overall financial health of the company. In this section, as well as profit and loss and cash flow, colour coding makes it easy to see if the accounts are in credit or not, with totals displayed in green for-profit and red if they’re in the negative. So, if payments are due, it becomes easy to see if there is enough money in a specific account to settle them or if cash needs to be moved around.
By offering quick and easy visualisation of these key performance indicators and metrics, keeping track of your finances and monitoring sales is simplified, while overdue invoices can become a thing of the past.
And remember, with our revamped Bank Feed integration for EU, UK, US and Canadian customers, transactions will be automatically refreshed four times a day, and seamlessly imported into AccountsPortal to ensure you always have access to the most up-to-date and accurate financial information possible.
Find out more about dashboards here or get in touch with us via our support pages.
Further Reading
How to Register as a Sole Trader
How to Leverage Technology and Automation to Support Your Firms Growth